EMRC - Red Hill
Weather Station Summaries
Note: If the plot appears blury on your computer screen after clicking the link below, click your curser in the centre of the plot once it's open. This will enlarge the plot to full size, enabling you to view it clearly.
| Site ID | Last 24Hrs | Last 7 Days | Last 30 Days | Entire Period |
|
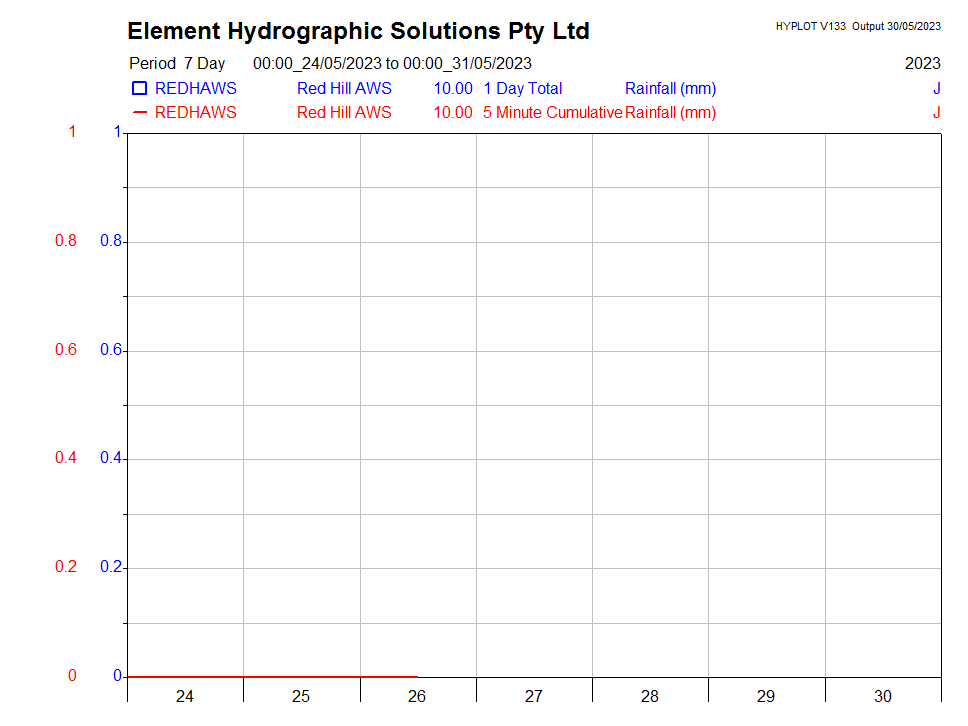
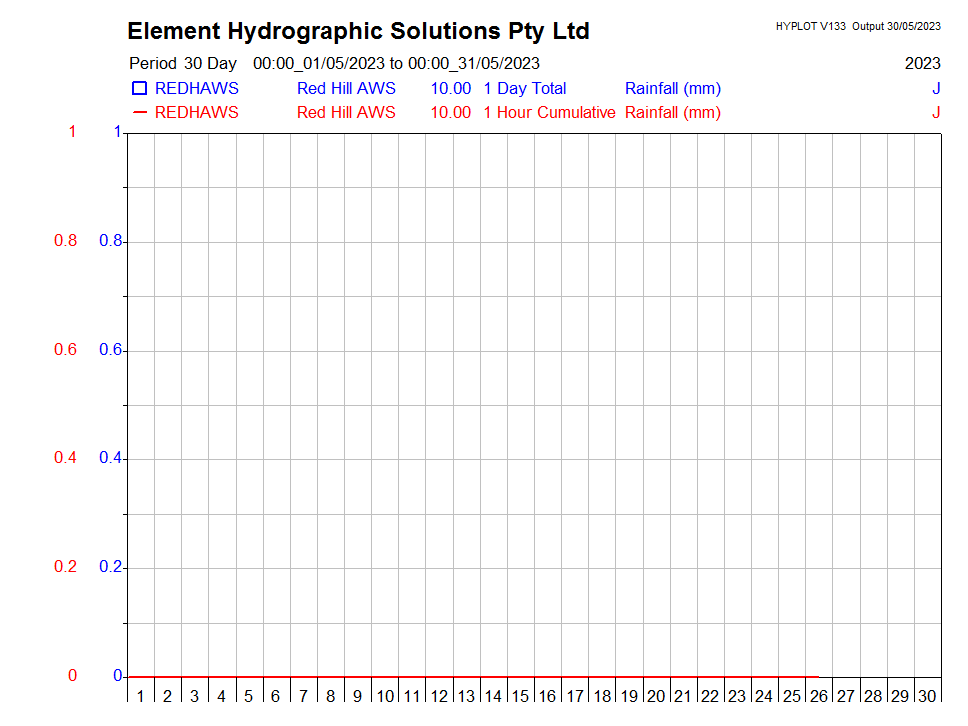
| Rainfall - Tipping Bucket Rain Gauge | REDHAWS | Plot | Plot | Plot | |
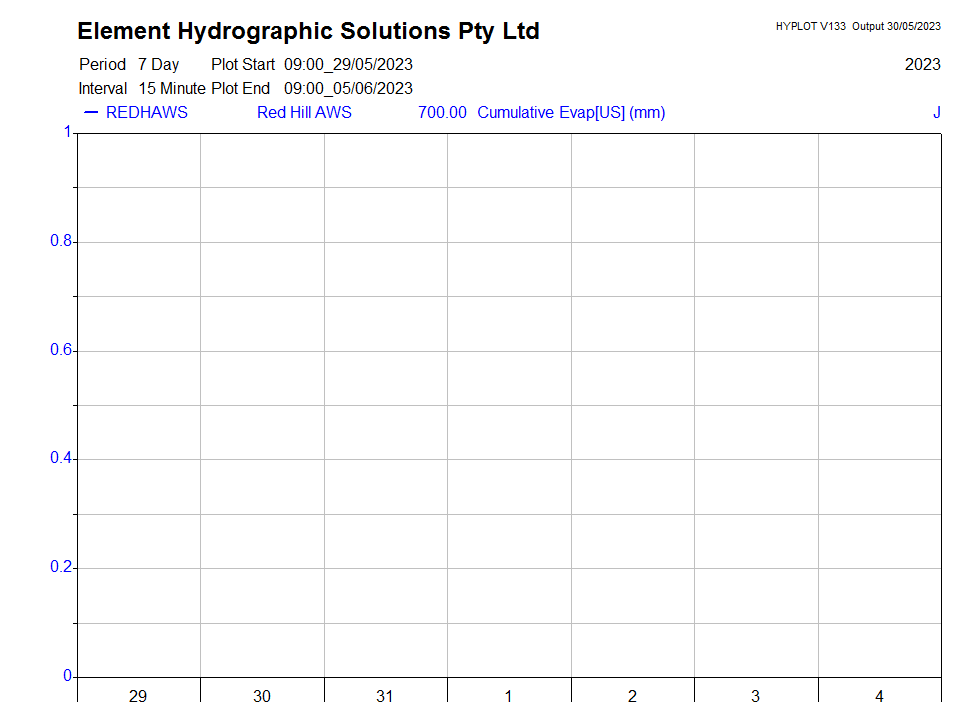
| Evaporation - Class A Pan (Auto) | REDHAWS | Plot | Plot | Plot | |
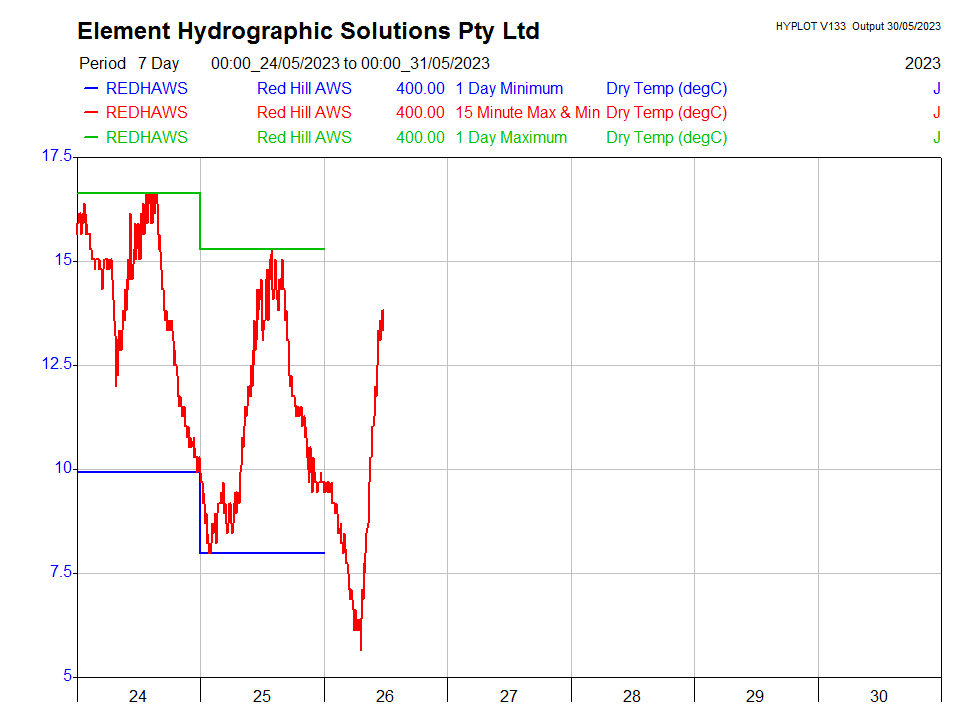
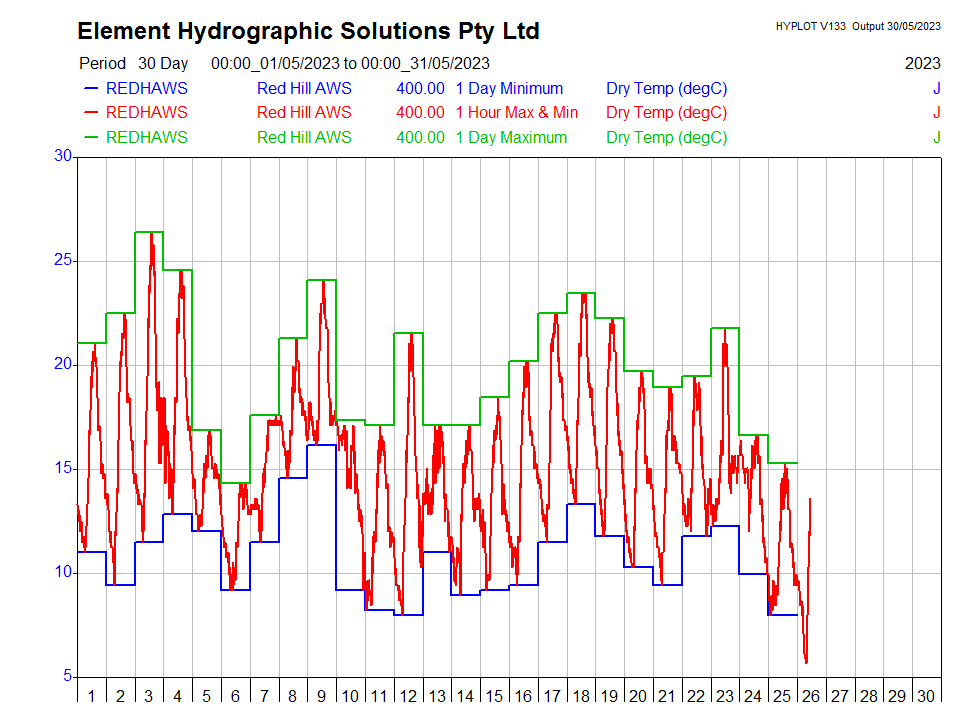
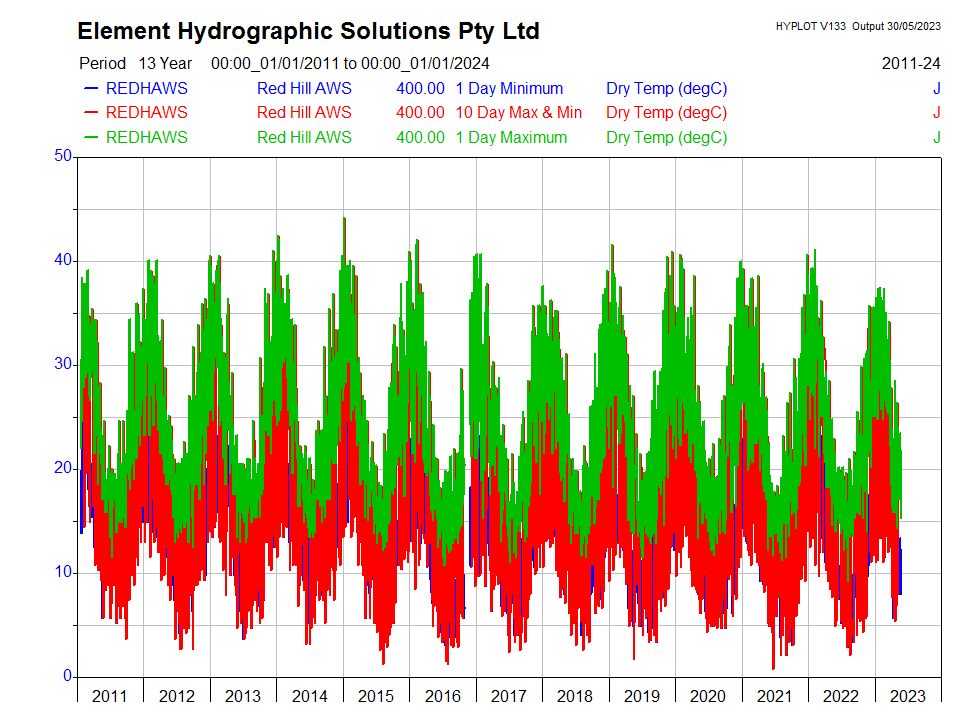
| Air Temperature - at 2 Metres | REDHAWS | Plot | Plot | Plot | Plot |
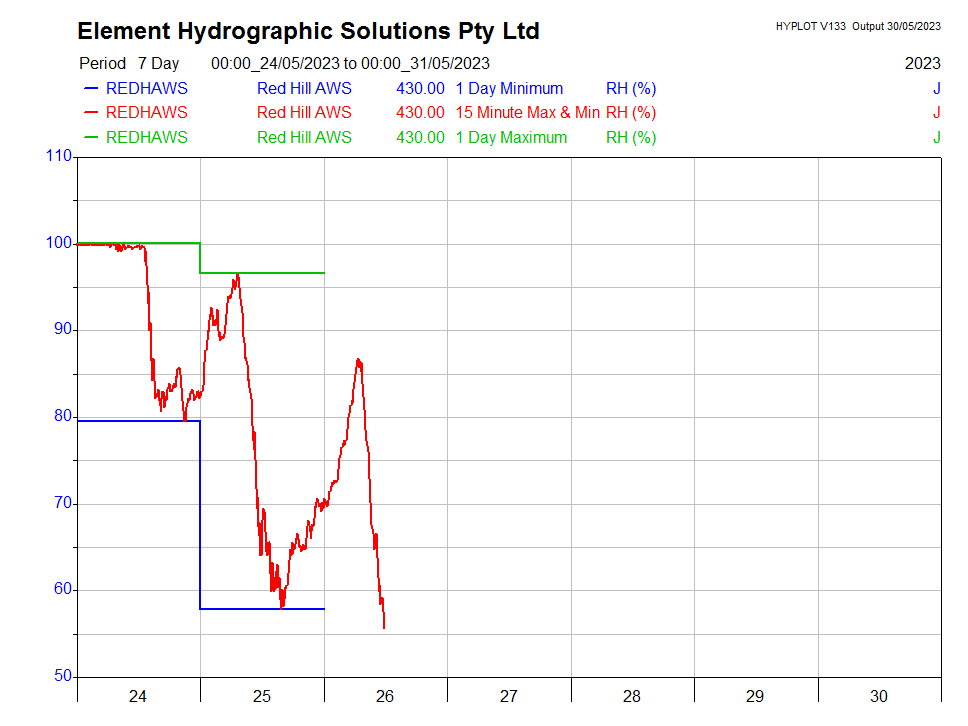
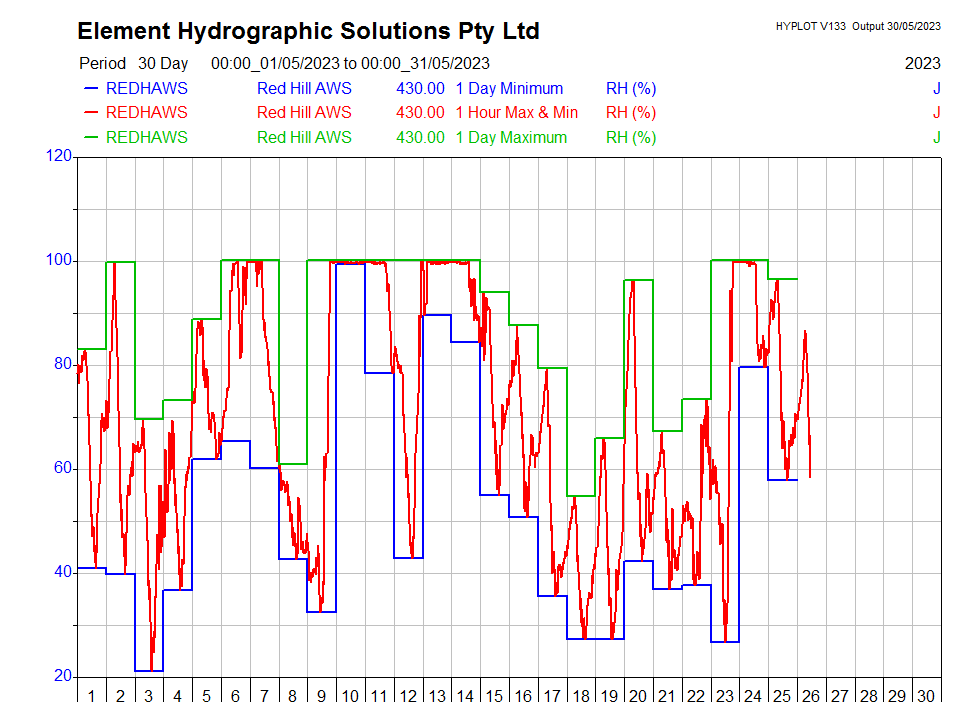
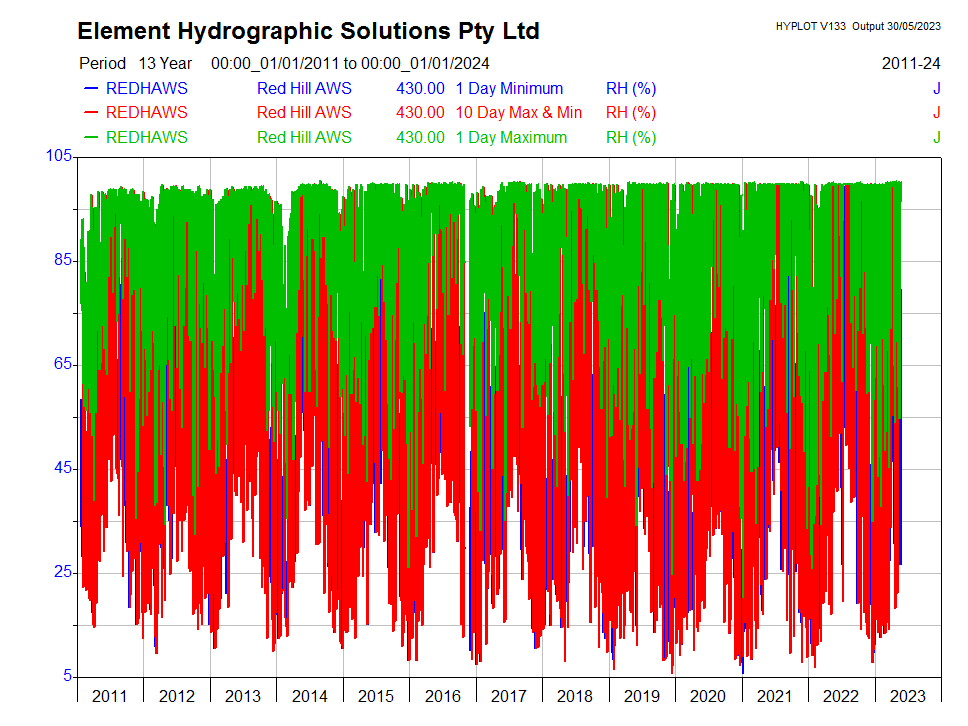
| Relative Humidity - at 2 Metres | REDHAWS | Plot | Plot | Plot | Plot |
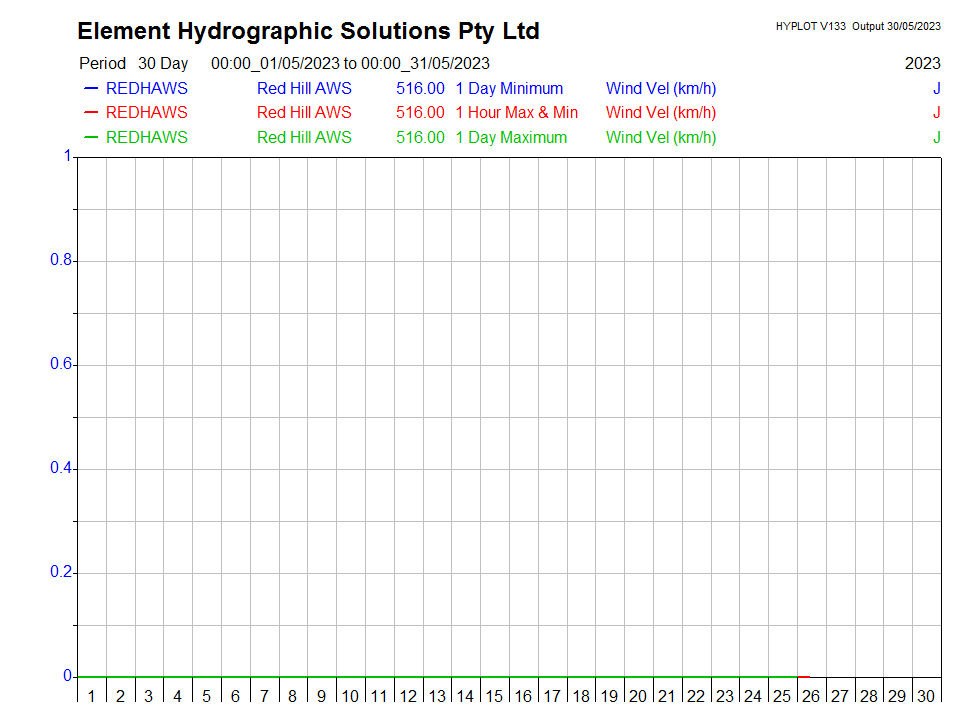
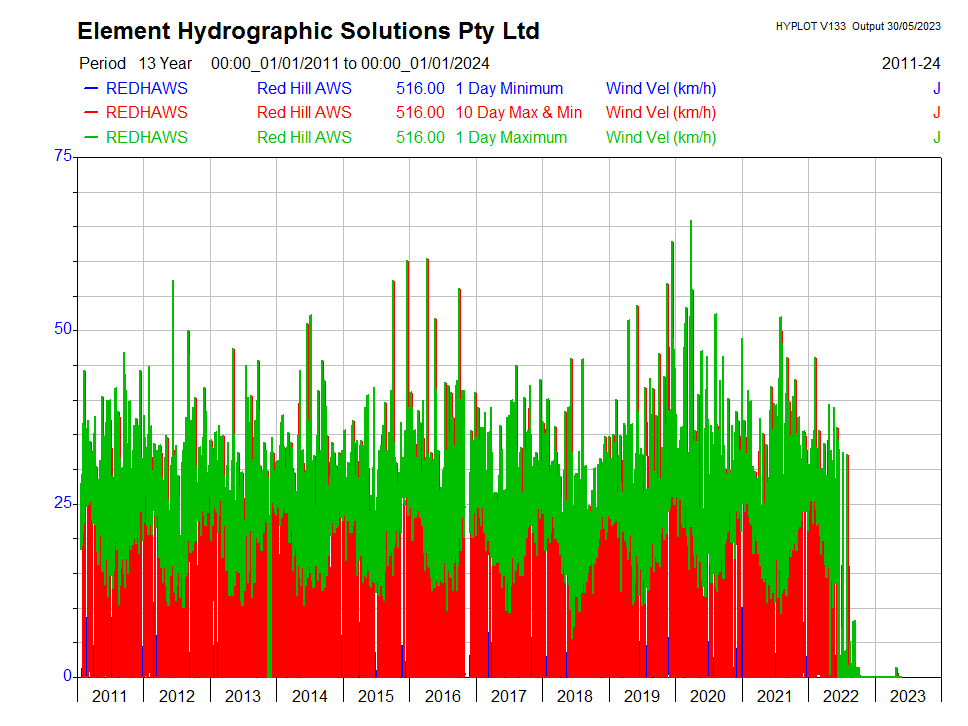
| Wind Speed - at 10 Metres | REDHAWS | Plot | Plot | Plot | Plot |
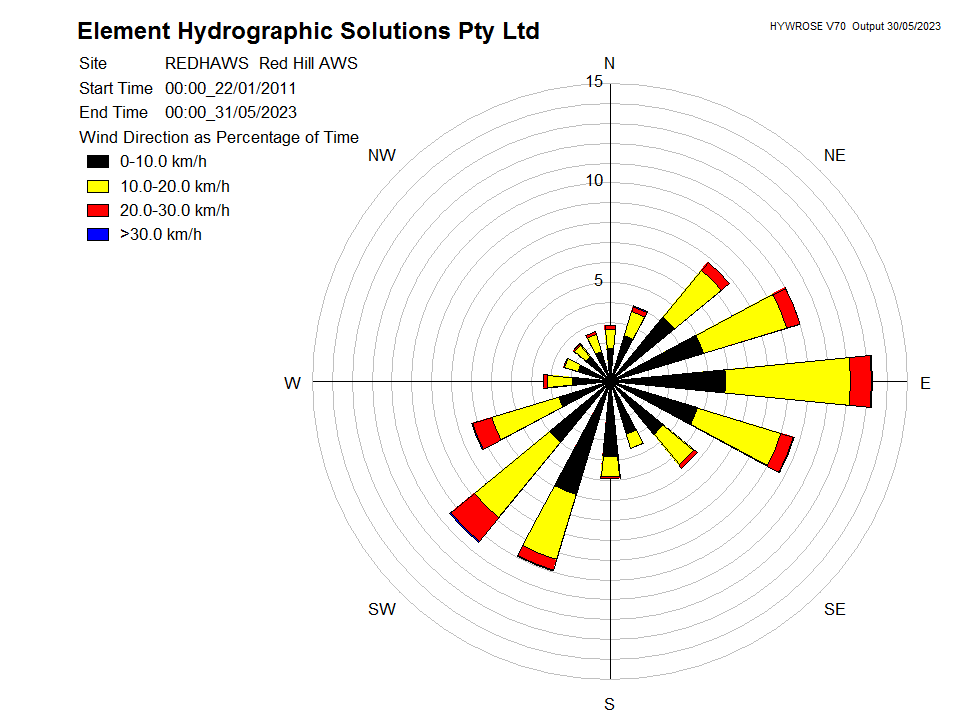
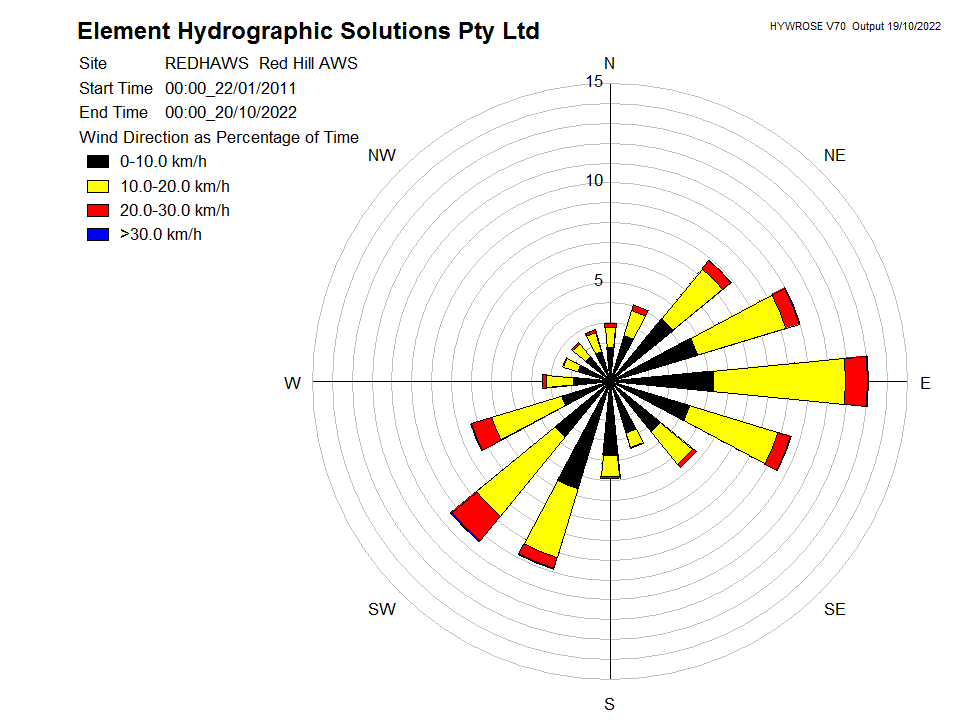
| Wind Direction - at 10 Metres | REDHAWS | Rose | Rose | Rose | Rose |
| Annual Comparison | Monthly Comparison | ||||
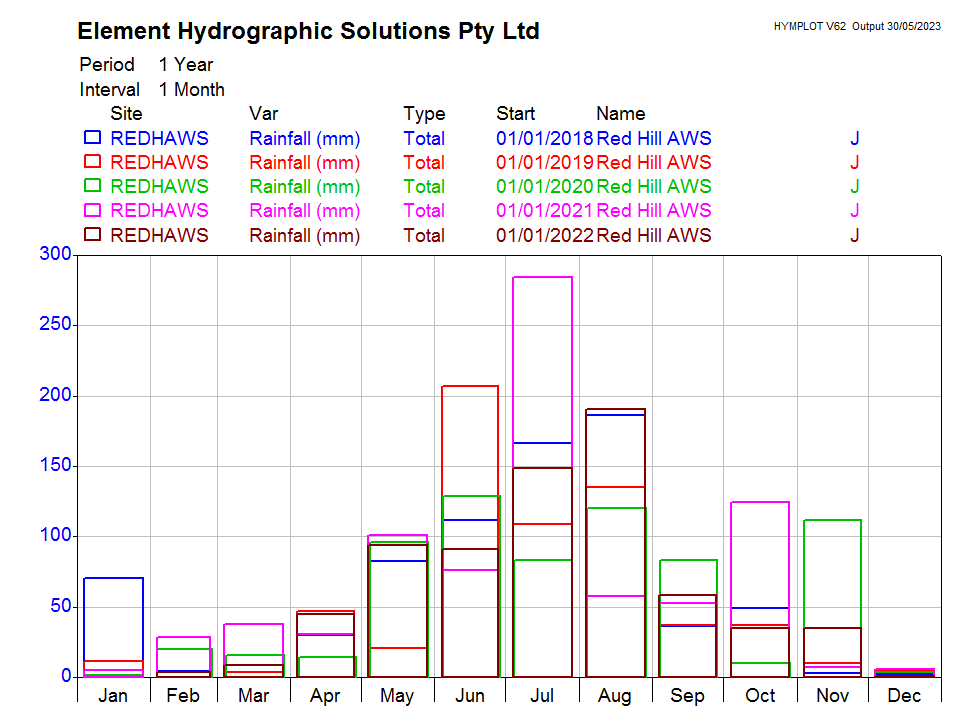
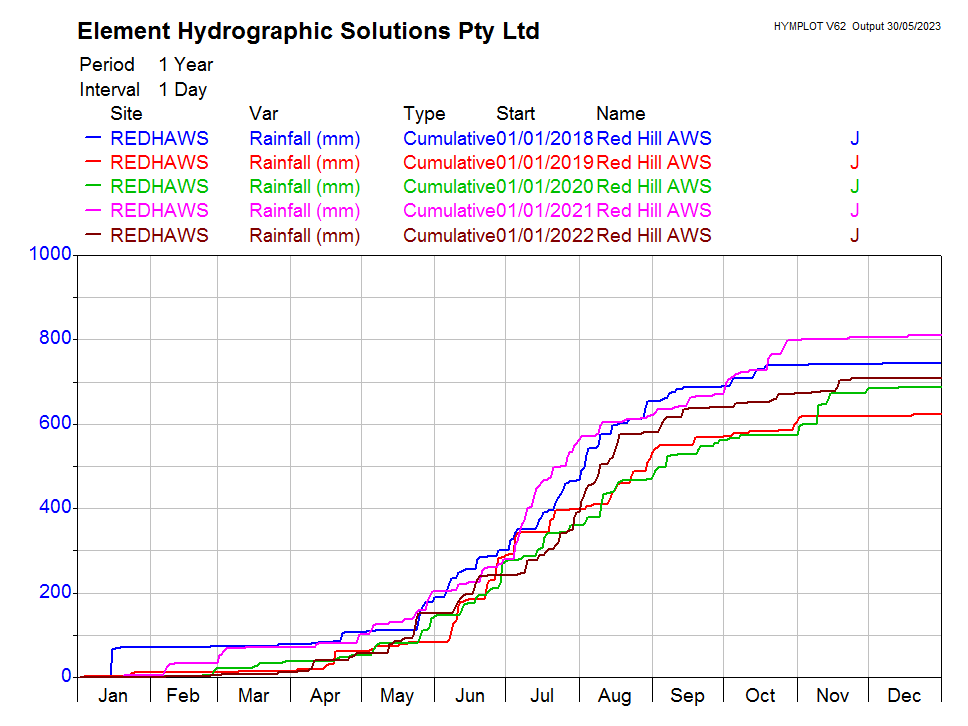
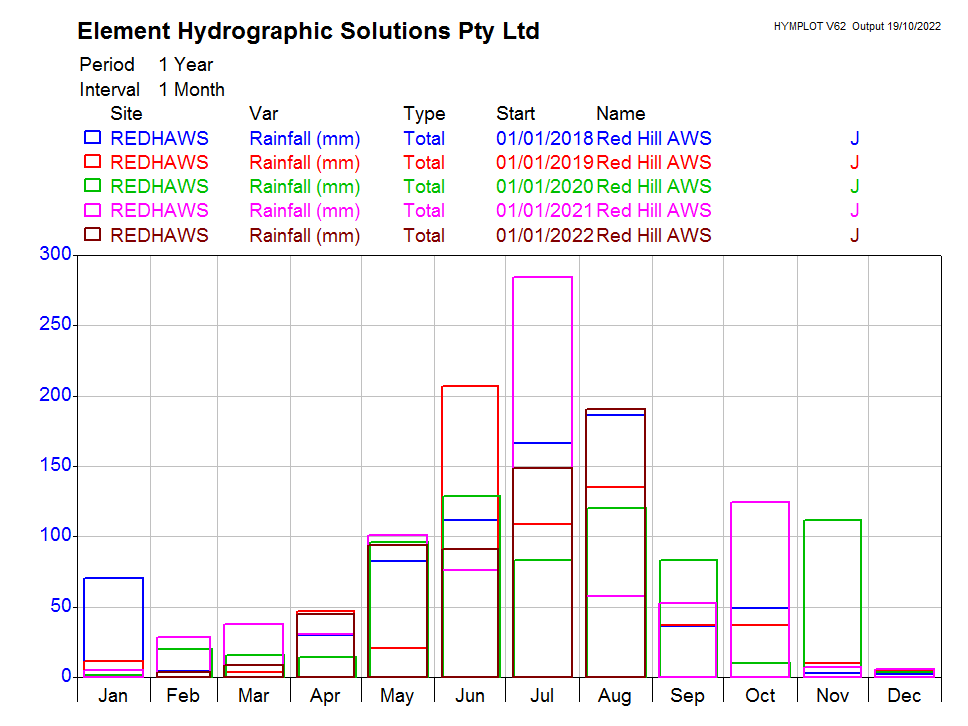
| Rainfall - Tipping Bucket Rain Gauge | REDHAWS | Plot | Plot | ||
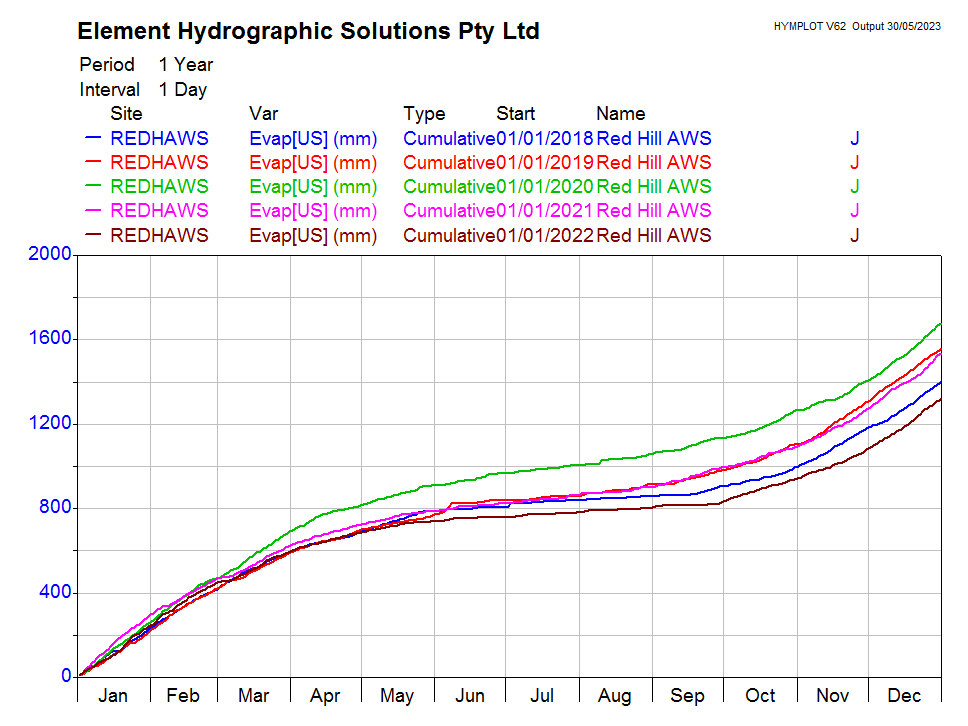
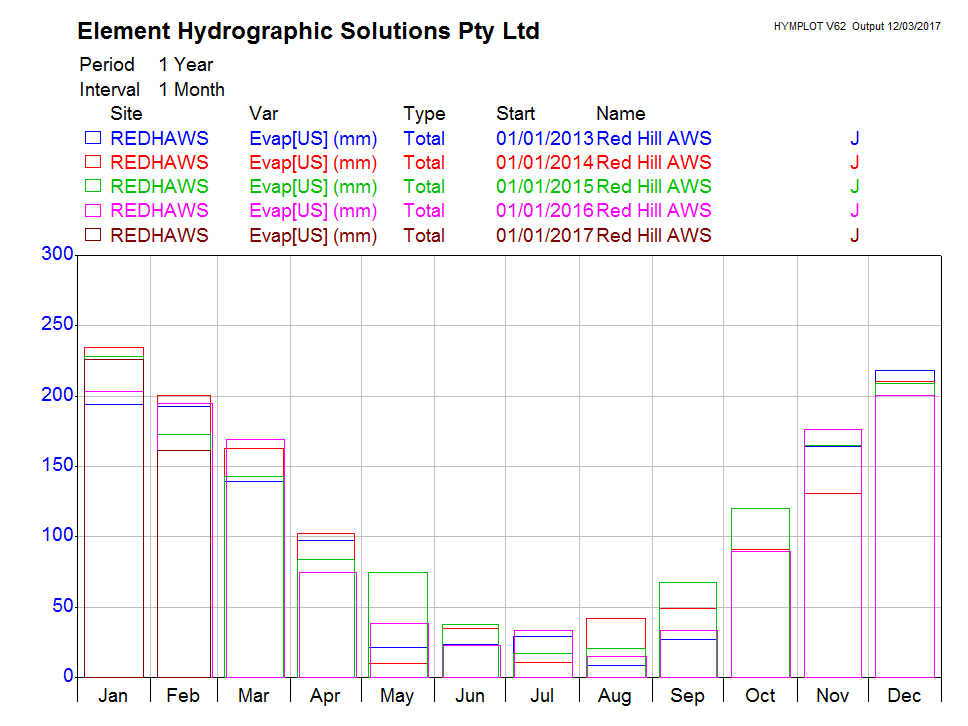
| Evaporation - Class A Pan (Auto) | REDHAWS | Plot | Plot |
| Daily Summary - Rainfall, Evaporation and Discharge (for the 24hrs ending at 09:00) | CSV File |
| Daily Weather Station Summary - All Parameters (for the 24hrs starting at 00:00) | CSV File |
15 min rainfall total and intensity (for the prev 30 days) |
|
| 5 min Logged Data - Wind Speed and Direction (for the previous 30 days) | CSV File |